EOS Detroit Social Cryptoexperiment
EOS Detroit Social Cryptoexperiment
No. 1 of 2 (2018)
DOID: 1770.20180717
Click and drag with your mouse to look around.Interact with the circles at the bottom to switch between scenes.
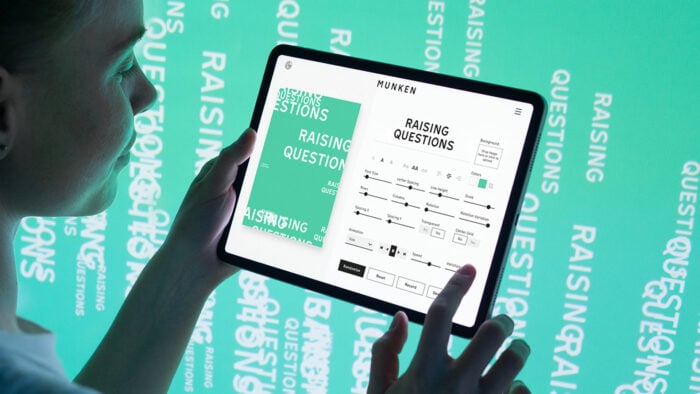
EOS data flow is a browser-based, interactive design-system at the intersection of digital art and data- visualization.
It’s premise is to make the EOS- blockchain more approachable by giving it a “physical” shape that is a real-time representation of its current state of transactions, actions, market movement and other datasets that define the current state of the blockchain. In this sense, EOS becomes something that can be experienced on a whole new level.
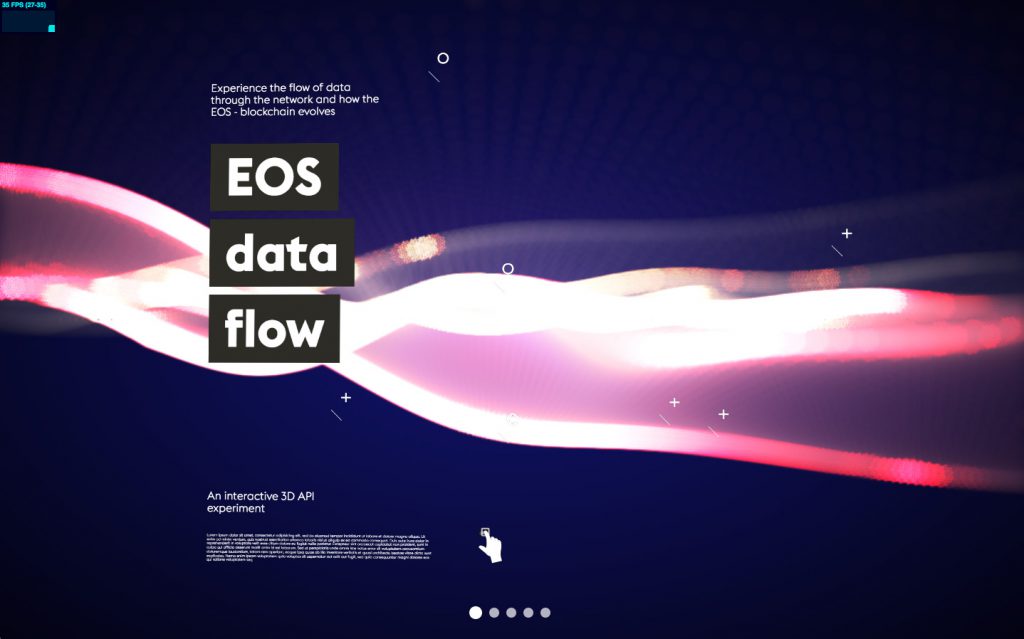
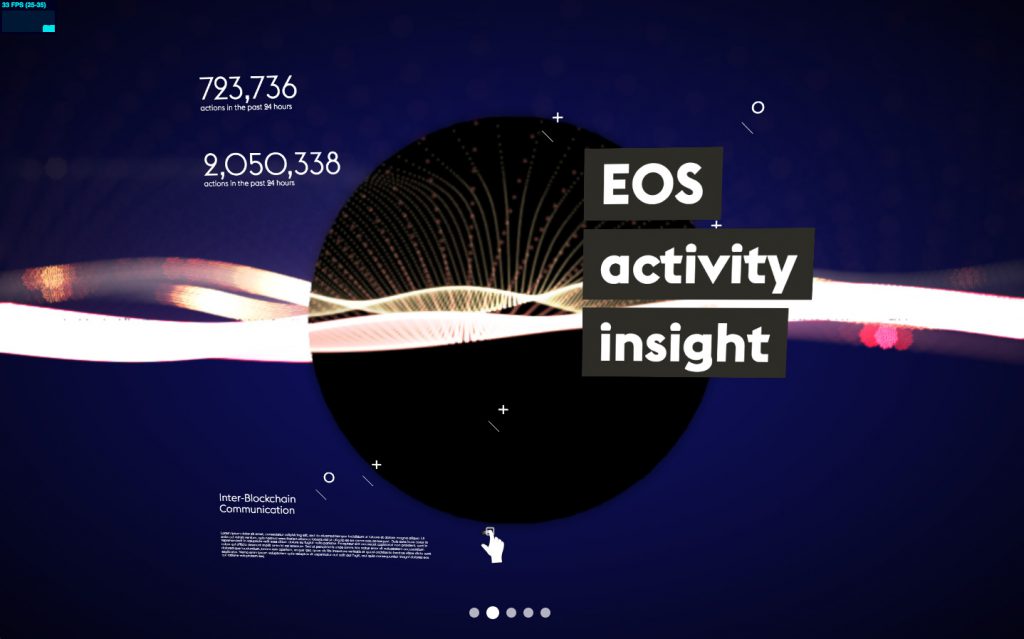
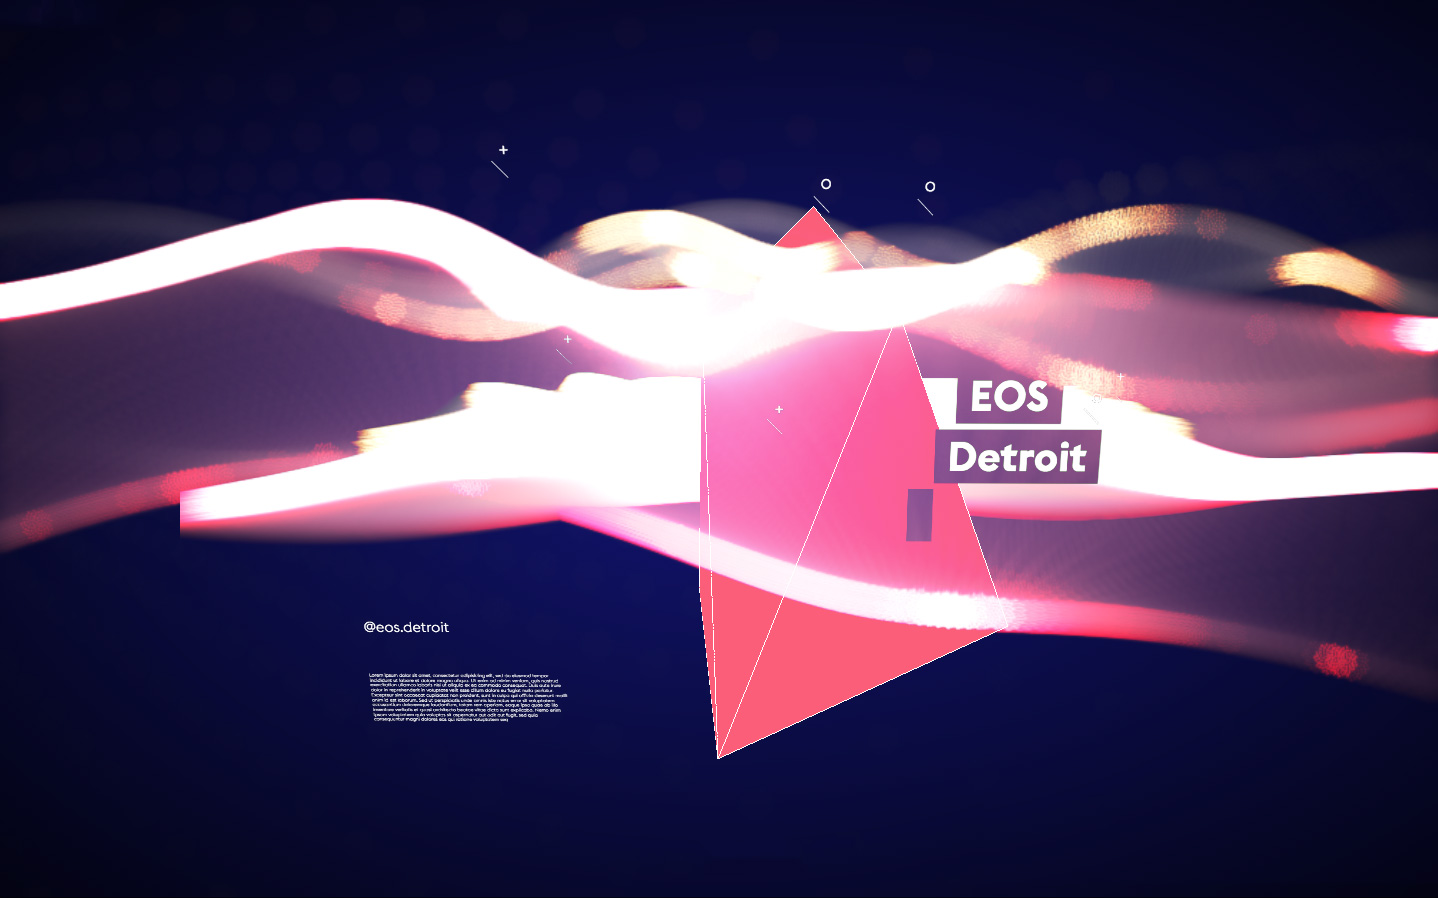
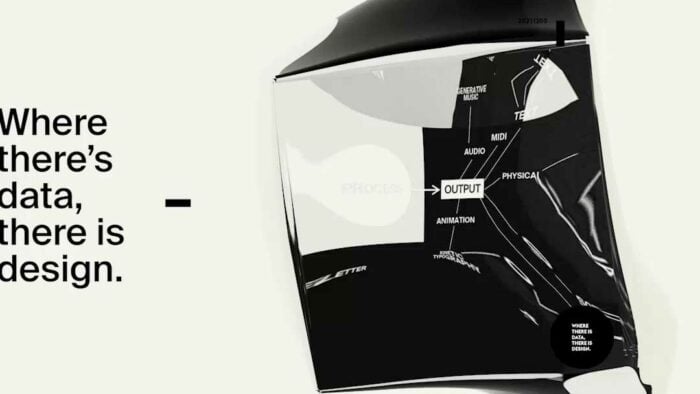
When you boot up the demo, you immediately see the dynamic wave-pattern of the EOS- blockchain. This wave is the meta-layer for the entire experience: The user can zoom in and out to different aspects and facets of the blockchain while always being surrounded by a real-time representation of the blockchain in flux.
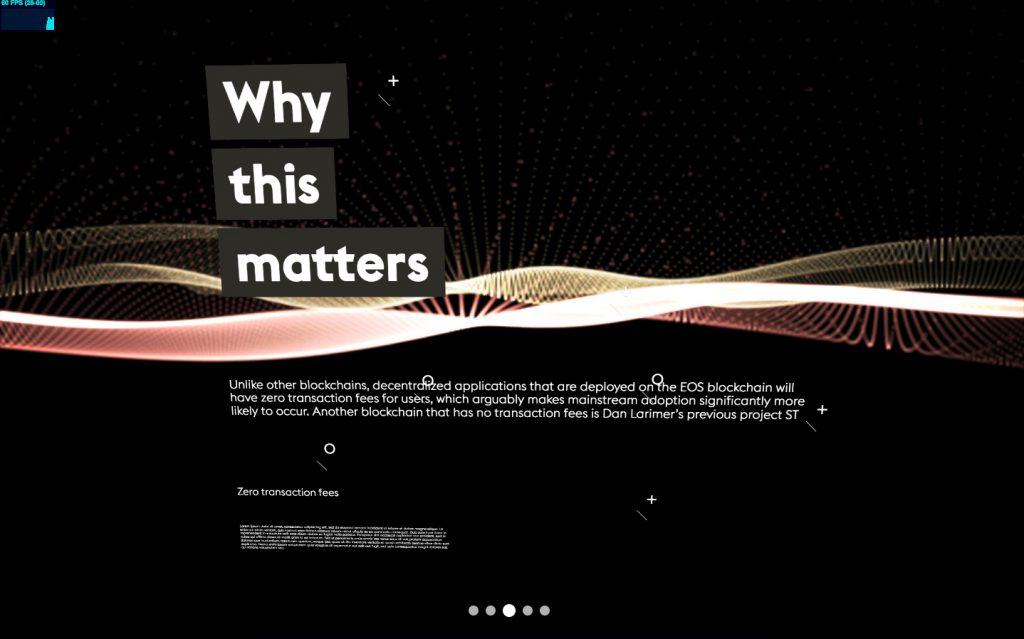
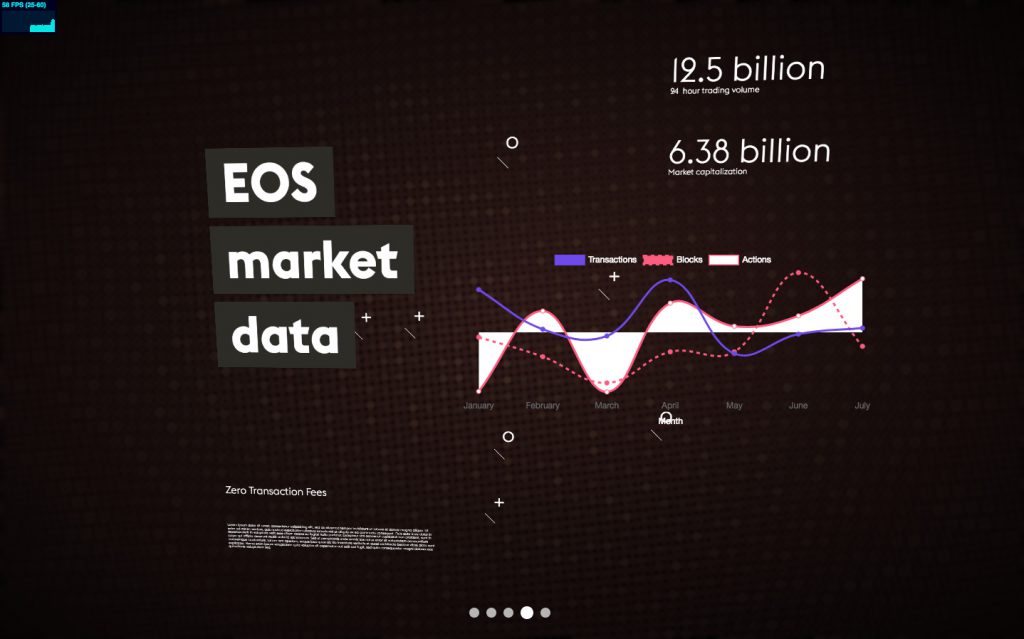
It will be interesting to see if patterns emerge, if market-trends have distinct visual features and if new insights can be gained from this meta-visualization.
EOS Detroit Social Cryptoexperiment ↘︎ More ideas in this series
EOS Detroit Social Cryptoexperiment
No. 2 of 2 (2018)
DOID: 1770.20180717